User question
Hello.
I bought a new laptop and noticed that it starts to make a lot of noise at times and gets hot. How can you not just see the temperature, but track it in real time (so that you can see the temperature sensors in the system tray, next to the clock). That is, to minimize any game using the Windows button and immediately see the temperature. Can it be so?
Part of the question has been cut out ...
Hello.
Sure you may. As for the fact that the laptop is noisy and warm, then most likely this happens during the launch of various games (video encoding, working with graphics, etc.). By the way, perhaps an article on high temperature and overheating of the device will also help you - //ocomp.info/greetsya-noutbuk.html
Now closer to the subject ...
*
Track and monitor temperature in real time
Option 1: HWiNFO64
Official website: //www.hwinfo.com/

CPU Information Window (HWiNFO64)
An excellent free utility for viewing the characteristics of a computer (the only drawback: it has a lot of different indicators that can "confuse" novice users). What is remarkable about the utility HWiNFO64 - in its arsenal there is a whole section "Sensors", which presents many load indicators and data from sensors that can be monitored in real time.
Let me show you how to configure them. And so, after starting the program - open the menu "Sensors" .

HWiNFO64 - looking at sensor readings
Next, you will see a large table with various indicators: temperature, voltage, CPU load, RAM, timing, etc. Shown not only the current values (see the Current column), but also the maximum, minimum, and average (Average).
To bring the necessary indicators to the tray - open the settings (see the screen below).

Settings - HWiNFO64 / Clickable
Next, go to the section "System Tray" and select the required indicator (just select this line), check the box "Show in Tray" (show in tray). In my example, I brought out the indicator "CPU (Tcti / Tdie)" - that is. current CPU temperature reading. Of course, you can put 5-10 sensor readings into the tray at once.

We take out the necessary readings in the tray
The screenshot below shows how these sensors will look (quite clearly and conveniently 👀).

Temperature, CPU load, RAM and other indicators - HWiNFO64
If the HWiNFO64 utility seemed confusing to you, I recommend turning to AIDA64 (this is a similar application, but not so loaded in Russian ...).
Option 2: AIDA64
Official website: //www.aida64.com/downloads
One of the most famous utilities for viewing the characteristics of a computer. As for the temperature, to view it, just open the tab "Computer / Sensors" ... See screenshot below.

AIDA64 - viewing temperature (sensors tab)
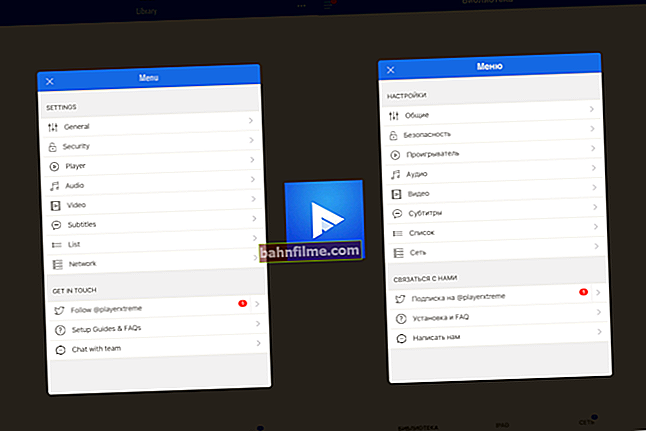
To move the required sensors to the tray: open the program settings, then go to the section "Gauge Icons" and check the boxes that you need. After saving the settings, the sensor readings will appear in the tray (an example is shown in the screenshot below).

Sensors with the required indicators are placed in the tray - AIDA64 / Clickable
If you want AIDA64 to load automatically when you turn on your computer, then in the settings section "General" check the box next to "Load AIDA64 at Windows Startup"(thus, after turning on the PC, you can immediately monitor the temperature readings) .

AIDA64 - load utility at Windows startup
Option 3: regarding games
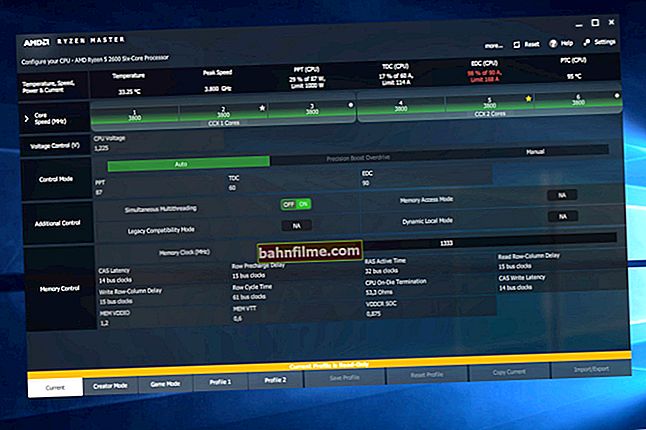
To monitor the temperature of the video card and processor directly in games - there is one great utility FPS Monitor .
FPS Monitor
Official site: //fpsmon.com/ru/

CPU & Graphics Temperature - FPS Monitor Utility
Using this utility, you can determine the load on each processor core, video card, RAM, network. In addition, it shows the temperatures of the video card (GPU) and CPU (CPU) in real time. You can see an example of her work in the photo above / below.
FPS Monitor perfectly helps to diagnose the cause of slowdowns in games - just look at the loading of the main components (by the way, the utility also highlights in red those components that are already loaded by 80-100%).

Max. CPU core load
To help!

Diagnostics. How to find out why the game slows down: because of the processor, video card or RAM - //ocomp.info/tormozit-igra-diagnostika.html
*
Add-ons are, as always, welcome ...
Good luck!
😉